
A practical article for e-commerce owners and leaders.
From the financial model to decisions about customers, products and assortment.
THE KEY IDEA: Revenue growth alone does not mean a business is making money. Profit comes from combining positive order margins with repeat purchases, a reasonable acquisition cost and an acceptable payback period.
1. Profit and Cash Are Different Things
Before calculating unit economics, we need to agree on what it means for a business to make money. A bank balance alone cannot answer that question, and neither can a revenue figure. At a minimum, a business leader needs to see both P&L and cash flow. Ideally, these are complemented by a balance sheet, which shows the company’s financial position: its assets, liabilities and equity.
P&L: Is the Business Model Healthy?
The P&L answers a fundamental question: does the company’s activity create economic value? It compares revenue with cost of goods, variable expenses and fixed costs, revealing whether each sale leaves a contribution that covers the team, operations and ultimately generates profit.
Cash Flow: Can the Business Last Until the Profit Arrives?
Cash flow answers a different question: when does money actually come in and go out? An online store can show a profit on its P&L while facing a cash shortfall. For example, it may pay a supplier upfront for a large shipment, hold the goods in a warehouse and receive money from customers only several weeks later. The faster purchasing grows, the more cash the business may need before that profit reaches its bank account.
This leads to an important distinction: a healthy business model does not guarantee a healthy business today. Even a profitable model can suffer from unfavorable payment terms, excessive inventory or growth that is too fast. These problems can often be addressed through working capital management, supplier negotiations, a credit line, factoring or changes to the purchasing cycle. But financing cannot rescue a model that loses money on every new customer or order; it merely funds those losses for longer. Fixing that situation requires changes to pricing, costs, the product, marketing or customer retention.
Why Unit Economics Starts with P&L
Unit economics brings the logic of P&L down to the smallest meaningful unit of the business. It shows whether repeating a particular action is profitable: acquiring one more customer, selling one more product or expanding a particular product category. Cash flow then tests whether the company can withstand the timing gap between spending and receipts.
2. What Counts as a Unit in E-commerce?
A unit is the building block around which the calculation is organized. In e-commerce, there are at least two useful choices: the customer and the SKU. They answer different management questions, so there is no need to choose one and ignore the other.
The customer as a unit shows whether acquisition pays for itself and how much economic value a person generates over the entire relationship with the store.
The SKU as a unit shows which products generate margin, which drive sales volume, and which tie up capital and make the assortment more complex.
When repeat purchases matter, the customer usually becomes the primary unit: a first purchase alone says little about the full value of the relationship. SKU analysis is still essential, however. Otherwise, a high LTV can conceal products on which the store consistently loses money, while a strong margin on an individual product can mask overly expensive marketing.
3. Customer Unit Economics: The Cost of Growth
Basic customer analysis requires four groups of data: acquisition cost, order metrics, repeat purchases and variable costs. Teams often look only at CAC, AOV and customer revenue. That is not enough: revenue is not profit.
CAC: Customer Acquisition Cost
CAC (Customer Acquisition Cost) measures how much the company spends to acquire one new customer. In its simplest form, it is acquisition spending divided by the number of new customers. A more developed model must define what goes into the numerator: advertising alone, or also agency fees, creative work, first-order discounts, tools and a share of marketing team salaries. Periods and channels can be compared only when CAC is defined consistently.
|
BASIC FORMULA CAC = spending on new customer acquisition / number of new customers Calculate CAC separately by channel, campaign, geography and, where possible, the product in the first order. |
AOV and Purchase Frequency
AOV (Average Order Value) measures how much a customer spends per order. Yet the same AOV can produce very different economics: one customer buys once, while another returns every month. AOV therefore needs to be considered alongside order frequency, retention and the length of the customer’s active relationship with the store.
LTV: The Customer’s Contribution, Beyond Revenue
LTV is often mistakenly treated as all the revenue a customer generates over the relationship with the store. For unit economics, a more useful measure is contribution LTV: the total contribution remaining after variable costs. Start with the order value and deduct the cost of goods, discounts, payment fees, variable logistics costs, delivery subsidies, packaging, returns, write-offs and other costs incurred specifically because of the order.
|
ORDER ECONOMICS Order contribution = net revenue − all variable costs of the order Contribution LTV is the sum of this contribution across all of a customer’s orders over the chosen horizon. |
LTV/CAC and the Payback Period
The LTV/CAC ratio shows how much contribution is generated for each unit of acquisition spending. A higher ratio leaves more room to cover fixed costs and generate profit. The 3:1 benchmark is often used as a quick check of scalability, but it is not a universal rule.
LTV/CAC below 1 means acquisition destroys value: the customer’s contribution does not recover CAC. These campaigns or segments need to be paused or reworked urgently.
LTV/CAC between 1 and 3 is a gray area. Growth can be risky, particularly with long payback periods, high fixed costs and limited cash flow. Pricing, margins, repeat purchases or CAC should be improved first.
LTV/CAC around 3 or higher often creates room to scale, but only if LTV is based on mature cohorts, CAC is not understated and the payback period is acceptable for the business.
The payback period is what connects P&L with cash flow. Two channels may have the same LTV/CAC, but one recovers CAC in two months while the other takes a year. The second channel will require much more working capital and may be beyond the company’s means, even if it looks profitable on paper.
Real example: Remilia Hair, a DTC haircare brand based in Miami, built its Shopify business on consumable products with strong repeat-purchase behavior. By modeling contribution LTV against acquisition cost at the cohort level, the team could present investors with a clear payback curve — not just top-line growth, but evidence that each acquired customer generated a net-positive contribution within an acceptable time frame. That unit economics discipline helped the company raise $700K in funding and grow Shopify revenue by over 200%.
What Can You Improve?
Customer unit economics is useful because it guides action, not simply because it produces a metric. Results can improve through lower CAC, better conversion, a higher average order value, more frequent repeat purchases, stronger retention, better order margins and fewer returns. Change one area at a time and assess the effect by cohort: a storewide average can easily hide both strong and weak segments.
Each of these improvements requires people with genuine e-commerce experience — whether it is a retention marketer who understands subscription logic, a PPC specialist who can optimize CAC by cohort, or a finance manager who can build and maintain unit economics models. For businesses looking to build or strengthen their in-house e-commerce team, working with a specialized recruitment partner such as Talents Boutique — which focuses exclusively on marketplace and e-commerce hiring across Amazon, Shopify, Walmart and other channels — can significantly reduce the risk of a mis-hire in a function leadership may not fully understand.
4. SKU Economics: Which Products Generate Profit?
The second level of analysis is the economics of an individual SKU. It is not always described as unit economics in the traditional sense, but it is critical in e-commerce: the assortment affects margins, marketing, warehousing, returns and working capital requirements at the same time.
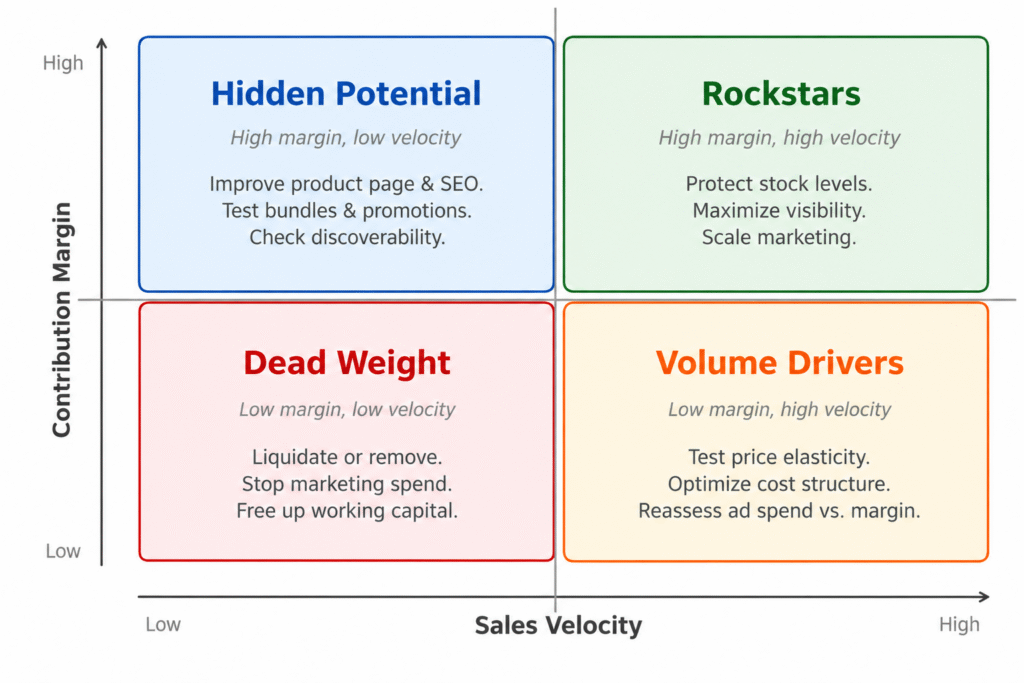
For each SKU, calculate more than the markup on its purchase price. Measure the full contribution margin per unit: the net price after discounts, less the cost of goods, marketplace or payment processing fees, variable logistics costs, packaging, expected returns, write-offs and other direct expenses. Then compare that margin with sales velocity: how quickly the product sells over a given period.
|
SKU ECONOMICS SKU contribution = net selling price − variable cost per unit Track the absolute contribution, the contribution margin percentage and sales velocity together. |
Decision Matrix: Margin × Sales Velocity
|
Margin |
Sales Velocity |
Role |
Primary Action |
|
High |
High |
Rockstar |
Keep it in stock, increase promotion, improve visibility and feature it across relevant categories. |
|
High |
Low |
Hidden potential |
Improve the product page, search visibility, placement and bundles first; test discounts after diagnosing weak demand. |
|
Low |
High |
Traffic or volume |
Test price elasticity, raise the price or reduce costs; preserve its role as an entry product. |
|
Low |
Low |
Dead weight |
Remove it from the assortment, clear remaining stock or retain it only if its strategic role is proven. |
This matrix should not trigger automatic decisions. A product with a high margin but slow sales does not necessarily need an immediate markdown: customers may not be finding it, the product page may explain its value poorly, or it may work better in a bundle. Equally, raising the price of a low-margin bestseller without further analysis can be a mistake if it brings in new customers. Every action should be assessed against pricing, demand elasticity and customers’ subsequent behavior.
5. Where the Business Really Makes Money: Customer × Product
The strongest insights emerge when customer and product analysis are combined. Group products by category, margin, role or use case, then examine which customers enter through each group and what they do next.
A useful unit of analysis here is the customer cohort defined by the product in the first order. For each cohort, measure CAC, first-order contribution, repeat purchase frequency, contribution LTV, LTV/CAC and the payback period. This reveals not only where the store made money today, but also which product started a relationship with a profitable customer.
A Low Margin Can Open the Door to a Profitable Customer
Sometimes a low-margin product acts as a gateway: it converts new visitors well, lowers the barrier to a first purchase and brings customers to the site. The first transaction generates very little profit, but the customer then buys high-margin consumables, accessories or related products regularly. Looking only at the first SKU’s margin could lead you to remove it. Looking at the entire cohort may reveal that it is your best source of profit.
Real example: Feel My Skin, a Paris-based skincare e-commerce brand, appeared to generate modest margins on its hero product. But when the team connected first-order product data to customer cohort analysis, the picture changed: customers who entered through the hero SKU went on to buy higher-margin serums and treatments repeatedly. The combined view showed a 22% net margin and €20–27K in monthly profit — a 35% revenue increase driven not by more traffic, but by understanding which product started the most valuable customer relationships.
A High Margin Does Not Guarantee Good Economics
The opposite can also happen. A product generates a high margin on a single order, but is promoted through an expensive channel, purchased only once and attracts customers who never return. Its LTV/CAC may be worse than that of a low-margin category with frequent repeat purchases. This is why assortment decisions cannot rely on margin alone, and marketing cannot be judged solely by first-order ROAS.
How to Interpret the Combined Analysis
Compare cohorts consistently: use the same LTV horizon, the same definition of CAC and the same treatment of variable costs.
Separate first orders from repeat orders: this shows which products acquire customers and which generate value from the relationship.
Watch the payback period: a strong lifetime contribution does not remove the need to fund the first few months.
Do not confuse correlation with causation: customers who buy a particular product may be more profitable because of the channel, season or audience, rather than the product itself.
6. A Practical Calculation Process
Unit economics becomes a management tool only when the calculations are repeated regularly and connected to decisions. Start with these six steps.
Reconcile P&L and cash flow. Make sure profitability and cash movements are considered separately, while revenue and cost definitions remain consistent across reports.
Define variable costs per order. Capture all costs associated with a sale: goods, discounts, payment processing, logistics, packaging, returns and write-offs.
Build customer cohorts. Start with the month of the first purchase and the acquisition channel, then add geography, campaign and the product in the first order.
Calculate CAC, contribution LTV and payback. Go beyond the storewide average; compare channels and segments over the same time horizon.
Calculate margin and sales velocity by SKU. Identify rockstars, hidden potential, volume drivers and dead weight, while checking each product’s strategic role.
Connect customers with products. Compare cohort LTV/CAC by first-order category and identify products that attract profitable customers, even when their own margins are modest.
7. What Does Making Money Really Mean?
The answer rarely sits in a single line of a report. E-commerce profit emerges from the interaction of five factors: order margin, acquisition cost, repeat purchases, CAC payback speed and working capital requirements. P&L shows whether the model is healthy; cash flow shows whether the company can sustain it over time; SKU analysis identifies the products that generate contribution; and customer analysis shows which relationships multiply that contribution.
The central question of unit economics is therefore not simply “Which product sells best?” or “Which channel delivers the highest ROAS?” It is: which customers, acquired through which products and channels, generate a positive contribution within an acceptable timeframe, and how much of that growth can the business finance?
Once you understand these connections, growth stops being a gamble. It becomes a repeatable, manageable process built on profitable economics.
Not sure where your e-commerce margins really stand?
John Galt Finance helps online brands build unit economics models, connect them to real P&L data, and turn numbers into decisions — from first-order contribution and SKU margins to full cohort LTV/CAC analysis.
— Free model templates and tools
— Book a free diagnostic call